---
title: Easier administration of Hue with the new Threads and Metrics pages
author: admin
type: post
date: 2018-02-02T01:09:46+00:00
url: /easier-administration-of-hue-with-the-new-threads-and-metrics-pages/
sf_thumbnail_type:
- none
sf_thumbnail_link_type:
- link_to_post
sf_detail_type:
- none
sf_page_title:
- 1
sf_page_title_style:
- standard
sf_no_breadcrumbs:
- 1
sf_page_title_bg:
- none
sf_page_title_text_style:
- light
sf_background_image_size:
- cover
sf_social_sharing:
- 1
sf_related_articles:
- 1
sf_sidebar_config:
- left-sidebar
sf_left_sidebar:
- Sidebar-2
sf_right_sidebar:
- Sidebar-1
sf_caption_position:
- caption-right
sf_remove_promo_bar:
- 1
ampforwp-amp-on-off:
- default
categories:
- Version 4
---
If you are an Administrator this post is for you! (in the contrary, the [SQL Editor][1] would be a great starting point).
In our last post we talked about [how to optimally configure Hue with the Analytic Database engines Impala and Hive.][2] This post describes how troubleshooting is getting easier for administrators, with the new Threads and Metrics pages. Those are in the Administration section, which can be accessed from the user menu:
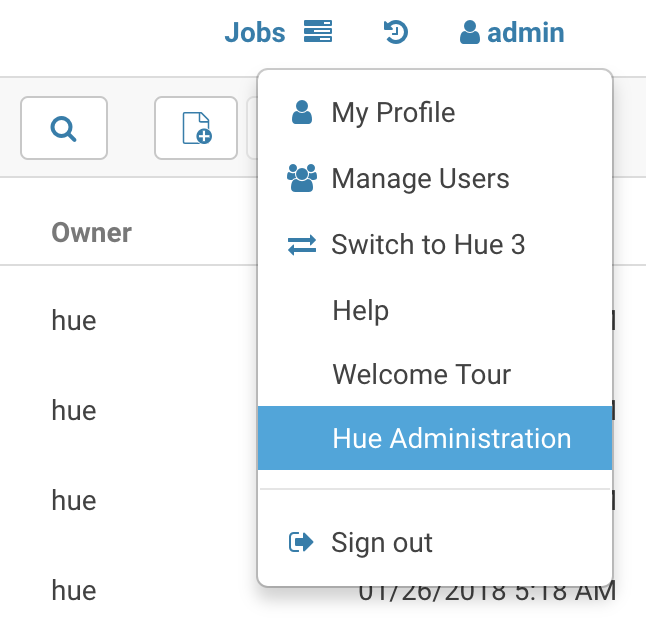
The Administration page link when logged-in as an admin
**Threads**
Threads page can be very helpful in debugging purposes. It includes a daemonic thread and the thread objects serving concurrent requests. The host name, thread name identifier and current stack frame of each are displayed. Those are useful when Hue "hangs", sometimes in case of a request too CPU intensive.
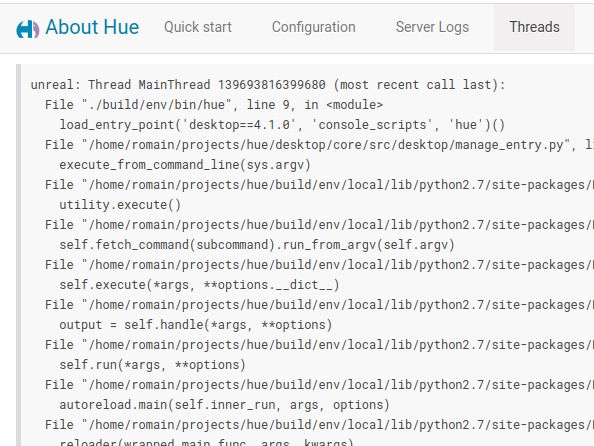
There is also a REST API to get the dump of Threads using ‘desktop/debug/threads’
**Metrics**
Hue uses the [PyFormance][3] Python library to collect the metrics. These metrics are represented as gauge, counters, meter, rate of events over time, histogram, statistical distribution of values. A REST API endpoint ‘/desktop/metrics/’ to get all the metrics dump as json is also exposed.
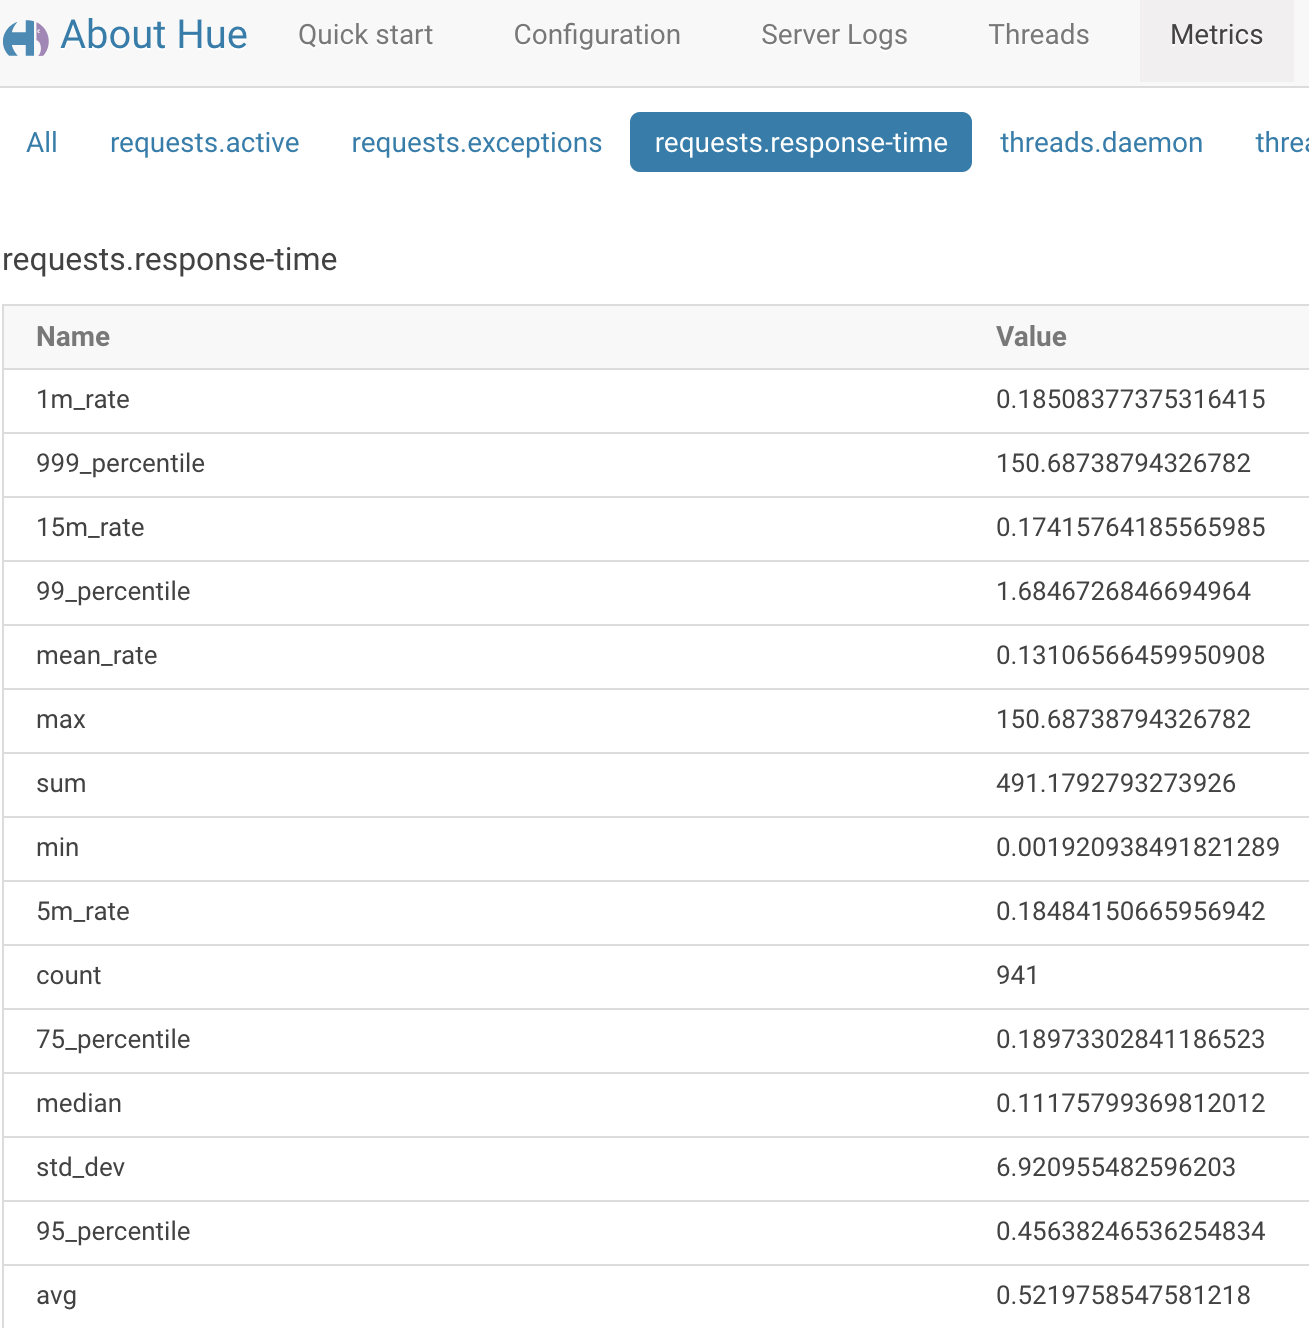
The below metrics of most concern to us are displayed on the page
requests.active
requests.exceptions
requests.response-time
threads.daemon
threads.total
users
users.active
One of the most useful ones are the percentiles of response time of requests and the count of active users.
Admins can either filter a particular property in all the metrics:
[ ][4]
Or select a particular metric for all properties:
[
 ][5]
[1]: https://gethue.com/sql-editor/
[2]: https://gethue.com/how-to-optimally-configure-your-analytic-database-for-high-availability-with-hue-and-other-sql-clients/
[3]: https://pyformance.readthedocs.io/
[4]: https://cdn.gethue.com/uploads/2018/02/Metrics_filter.png
[5]: https://cdn.gethue.com/uploads/2018/02/Metrics_selected_page.png

 ][4]
Or select a particular metric for all properties:
[
 ][5]
[1]: https://gethue.com/sql-editor/
[2]: https://gethue.com/how-to-optimally-configure-your-analytic-database-for-high-availability-with-hue-and-other-sql-clients/
[3]: https://pyformance.readthedocs.io/
[4]: https://cdn.gethue.com/uploads/2018/02/Metrics_filter.png
[5]: https://cdn.gethue.com/uploads/2018/02/Metrics_selected_page.png