operations.md 6.8 KB
title: "Operations" date: 2019-03-13T18:28:09-07:00 draft: false
weight: 2
Admin Wizard
The Quick Start wizard allows you to perform the following Hue setup operations by clicking the tab of each step or sequentially by clicking Next in each screen:
- Check Configuration validates your Hue configuration. It will note any potential misconfiguration and provide hints as to how to fix them. You can edit the configuration file described in the next section.
- Connectors The list of services to query or browse
- Examples get started with examples of SQL tables, queries, workflows and jobs to run.
- Users contains a link to the User Admin application to create or import users and a checkbox to enable and disable collection of usage information.
Configuration
Displays a list of the installed Hue applications and their configuration.
Hue ships with a default configuration that assumes a various set of services to be present in the cluster. If you are running on a real cluster, you can customize the hue.ini configuration file (/etc/hue/hue.ini when installed from the package version) or pseudo-distributed.ini in desktop/conf when in development mode).
Click the tabs under Configuration Sections to see the settings configured for each application. For information on configuring these settings, see Configuration.
Hue loads and merges all of the files with extension .ini located in the /etc/hue directory. Files that are alphabetically later take precedence.
After editing the ini file, Hue needs to be restarted.
Configuration Validation
To view the configuration of a running Hue instance, navigate to:
http://<hue>/hue/dump_config
The location of the folder containing the Hue ini files is shown at the top of the page as well as all the configuration values with help and information on the default values.
To list all available configuration options via the command line, run:
/usr/share/hue/build/env/bin/hue config_help | less
Server Logs
Displays the Hue Server log and allows you to download them to your local system in a zip file.
Threads
Threads page can be very helpful in debugging purposes. It includes a daemonic thread and the thread objects serving concurrent requests. The host name, thread name identifier and current stack frame of each are displayed. Those are useful when Hue “hangs”, sometimes in case of a request too CPU intensive. There is also a REST API to get the dump of Threads using desktop/debug/threads.
Metrics
Hue uses the PyFormance Python library to collect the metrics. These metrics are represented as gauge, counters, meter, rate of events over time, histogram, statistical distribution of values. A REST API endpoint /desktop/metrics/ to get all the metrics dump as json is also exposed
The below metrics of most concern to us are displayed on the page:
- requests.active
- requests.exceptions
- requests.response-time
- threads.daemon
- threads.total
- users
- users.active
One of the most useful ones are the percentiles of response time of requests and the count of active users. Admins can either filter a particular property in all the metrics or select a particular metric for all properties
Logging
The Hue logs are found in /var/log/hue, or in a logs directory under your
Hue installation root. Inside the log directory you can find:
- An
access.logfile, which contains a log for all requests against the Hue web server. - A
supervisor.logfile, which contains log information for the supervisor process. - A
supervisor.outfile, which contains the stdout and stderr for the supervisor process. - A
.logfile for each supervised process described above, which contains the logs for that process. - A
.outfile for each supervised process described above, which contains the stdout and stderr for that process.
If users on your cluster have problems running Hue, you can often find error messages in these log files. If you are unable to start Hue from the init script, the supervisor.log log file can often contain clues.
In addition to logging INFO level messages to the logs directory, the Hue web server keeps a small buffer of log messages at all levels in memory. You can view these logs by visiting http://myserver:8888/hue/logs. The DEBUG level messages shown can sometimes be helpful in troubleshooting issues.
Commands
Type the following command from the Hue installation root.
cd /usr/lib/hue (or /opt/cloudera/parcels/CDH-XXXXX/share/hue if using parcels and CM)
build/env/bin/hue shell
To list all the available commands:
build/env/bin/hue
Troubleshooting
To troubleshoot why Hue is slow or consuming high memory, admin can enable instrumentation by setting the instrumentation flag to True.
[desktop]
instrumentation=true
If django_debug_mode is enabled, instrumentation is automatically enabled. This flag appends the response time and the total peak memory used since Hue started for every logged request.
Instrumentation enabled
[17/Apr/2018 15:18:43 -0700] access INFO 127.0.0.1 admin - "POST /jobbrowser/jobs/ HTTP/1.1" `returned in 97ms (mem: 135mb)`
Instrumentation not enabled
[23/Apr/2018 10:59:01 -0700] INFO 127.0.0.1 admin - "POST /jobbrowser/jobs/ HTTP/1.1" returned in 88ms
Exporting Documents
Export all documents:
./build/env/bin/hue dumpdata desktop.Document2 --indent 2 --natural > data.json
Export specific documents:
20000013 is the id you can see in the URL of the dashboard.
./build/env/bin/hue dumpdata desktop.Document2 --indent 2 --pks=20000013 --natural > data.json
You can specify more than one id:
--pks=20000013,20000014,20000015
Load the documents:
./build/env/bin/hue loaddata data.json
Slow because too documents
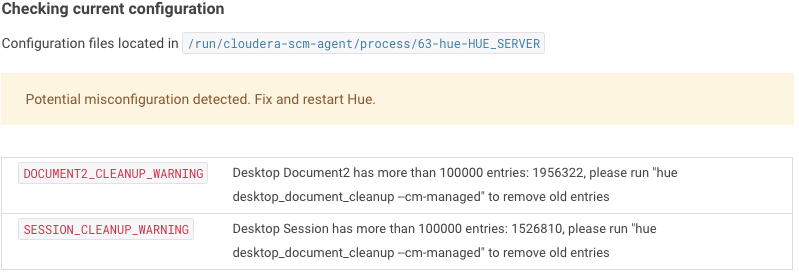
When the database has too many entries, it will cause performance issue. The config check will help superuser to find this issue. Login as superuser and go to “Hue Administration”, this sample screenshot will be displayed in the quick start wizard when the tables have too many entries.
To clean up Hue database, go to Hue directory and run following clean up command:
./build/env/bin/hue desktop_document_cleanup
Too many connections
When getting an error similar to OperationalError: (1040, 'Too many connections'), this indicates that the Hue database is overloaded and out of connections. Hue only needs 2 but often the database is used by other services that might "hog" them. Increasing max_connections to around 1000 should be sufficient. e.g. for MySQL, connect to it and set below parameter:
mysql> SET GLOBAL max_connections = 1000;
Database
See the dedicated Database section.
